Being a Dux-Soup Turbo user, you already have access to many new options that help with your overall lead generation automation process. One of those options is the feature called “Webhooks”, which helps you set up a trigger to link Dux-Soup Turbo with any other external app.
In this guide, we’ll be looking at how you can connect Dux-Soup Turbo to Databox via Zapier, and how doing so can help you in handling all the Dux-Soup Turbo data and analytics better.
Databox pulls all your data in one place, so that you can track performance and discover insights in real-time. Combined with Dux-Soup Turbo, you can build your own dashboard, set up measurable goals, track progress and get performance alerts as they come.
If you’re looking to spot specific trends within your LinkedIn automation actions - this guide is for you.
First, though, you need to be able to set up Webhooks through Zapier. So, be sure you know how to use Webhooks in Dux-Soup Turbo before moving on.
Connecting Databox to Zapier
In this guide, we’ll be looking at how to track automated profile visits and follow-ups in Databox.
Let’s go through it step by step.
Once you’ve set up your Webhook and know what you want to track, the next step is to pick an action step in Zapier - click “Add a step” and choose “Action/Search” as per the example below:
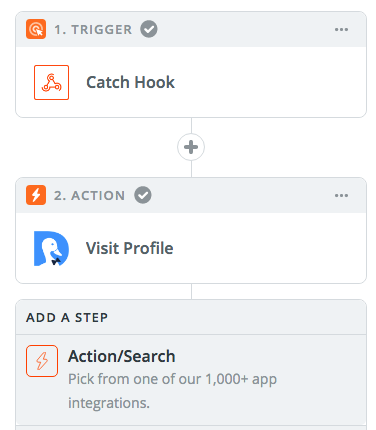
Because we’re integrating the action to Databox, choose the app here.

Then, select the Databox action. Since we’re tracking the performance, you need to select “Increase Counter”.

After that, you’re almost done with Zapier. Just select your Databox account and hit “Test”.
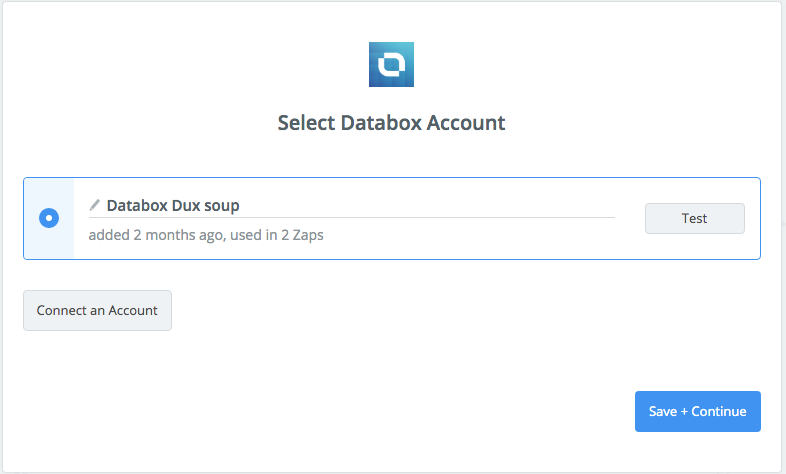
If you’ve been following the steps accurately, the test should be a success.

Now, all you have to do select “Use a custom value” from the drop-down box and give it a name.
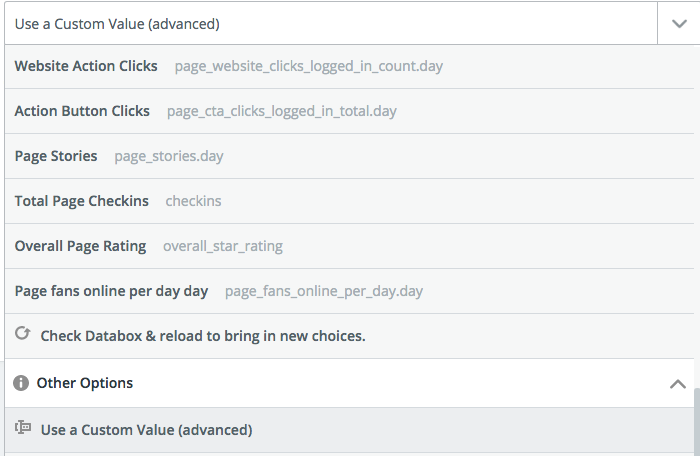
And then, type in the custom value name below, like so:

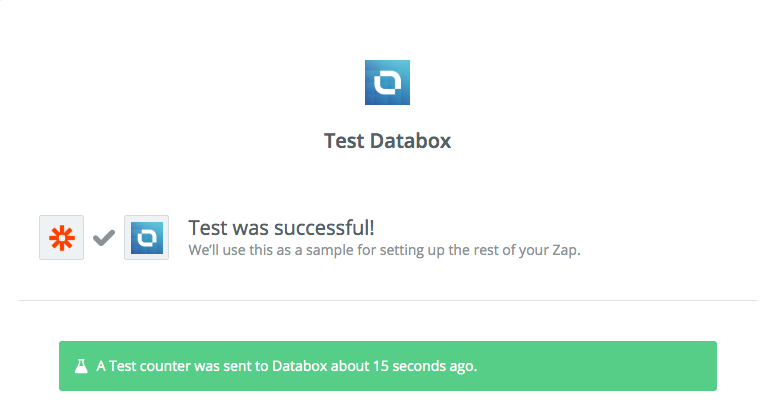
Then, moving onto the final step, test it again to make sure everything is working as intended and after that, you can finally move onto setting up Databox. By doing this, you’re sending test data to Databox to make sure the dashboards are working properly.
Setting Up Databox
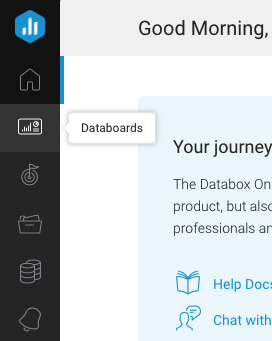
Once you move onto Databox, the first thing you need to do is set up a Databoard which is found on the left-hand side of the screen:
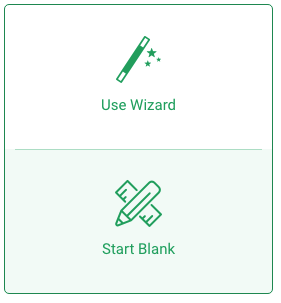
Then, you create a new blank databoard - click “Start Blank” to create one.
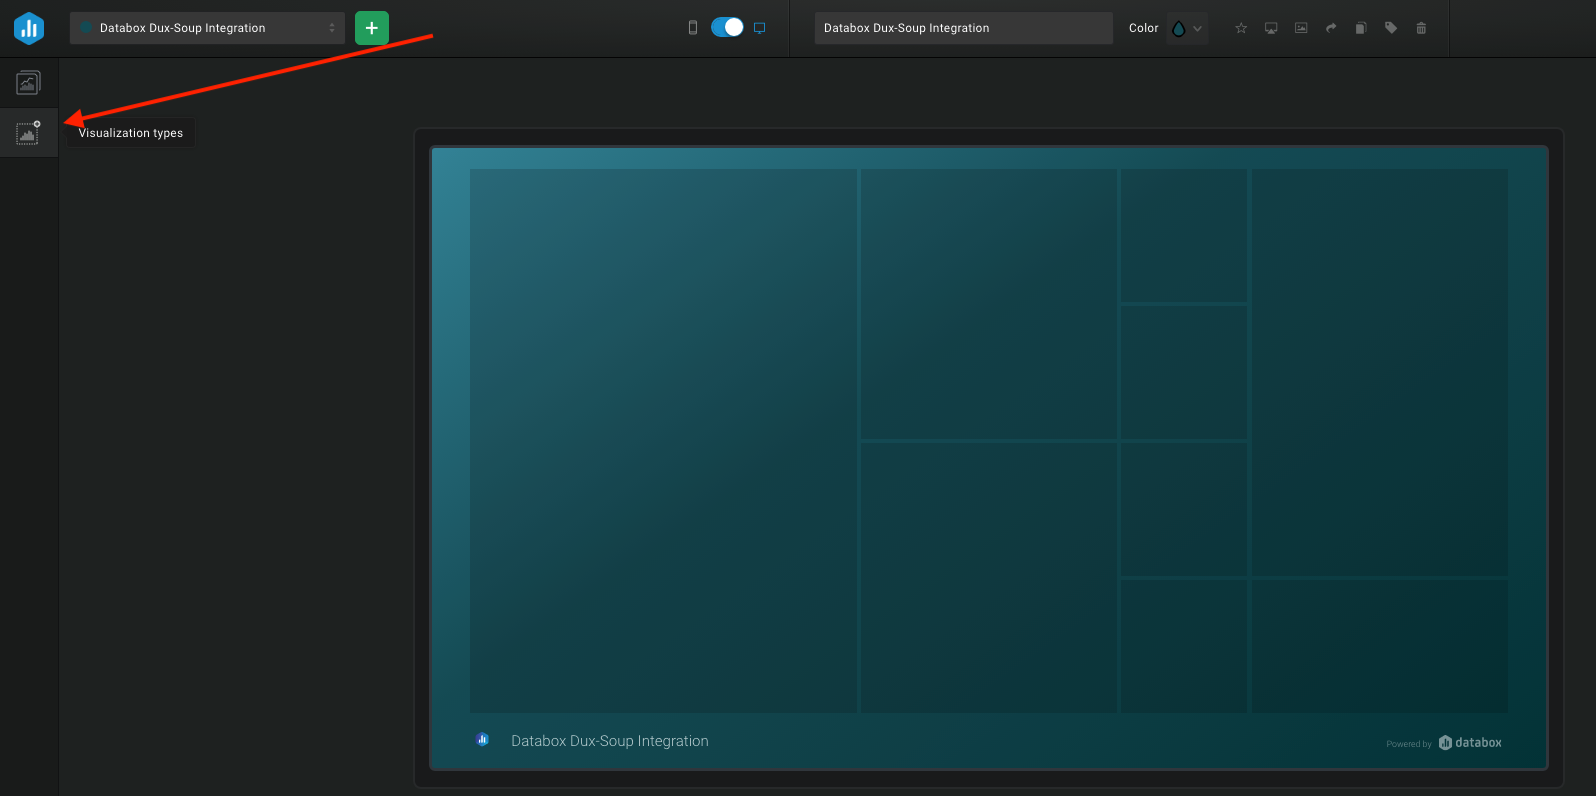
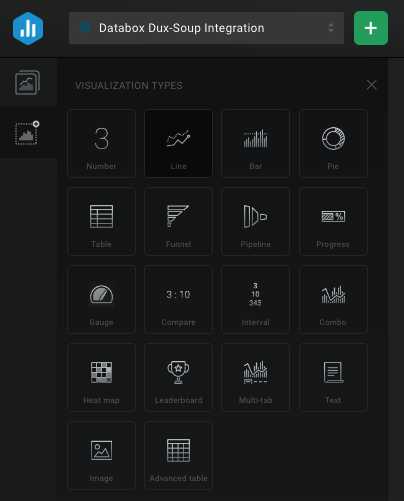
Go to visualization types on the left-hand side of the screen and pick the type.
As an example, we’re picking the “line” type, and then drag it onto the empty dashboard.
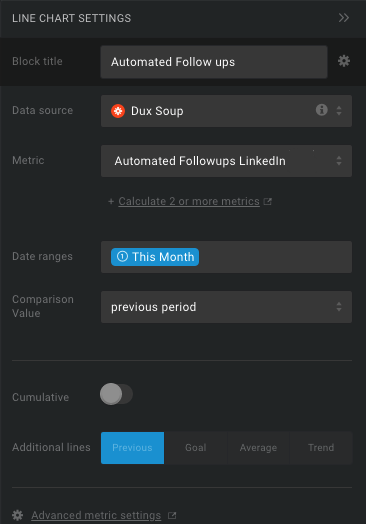
Then, on the right side, in the settings, add a title, select Dux Soup as data source and add your custom value for the chosen metric along with the time frame you want to track. This is what that should look like:

For the “LinkedIn Profile Visits”, this is what the end result should look like with the dashboard:
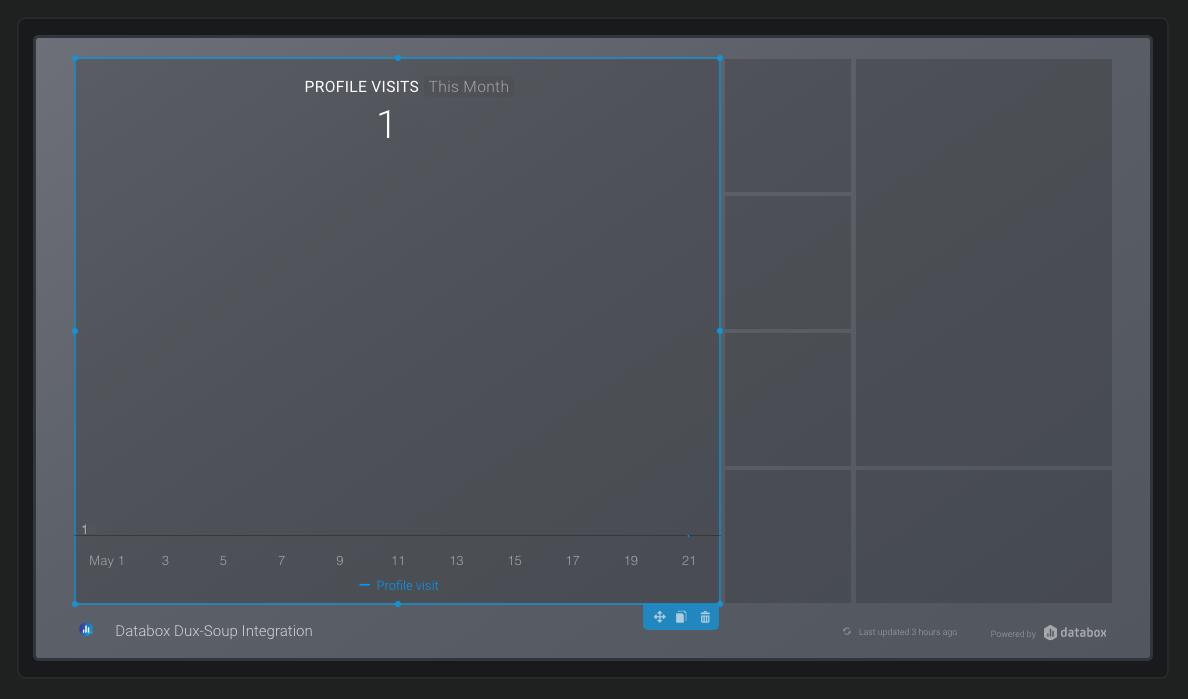
Since we also want to track the automated follow-ups, we need to add another “line” visualization type and select the settings so that it matches the follow up Zap.
To see how you can set up tracking automated follow-ups, make sure you’re familiar with the follow up messaging feature first.
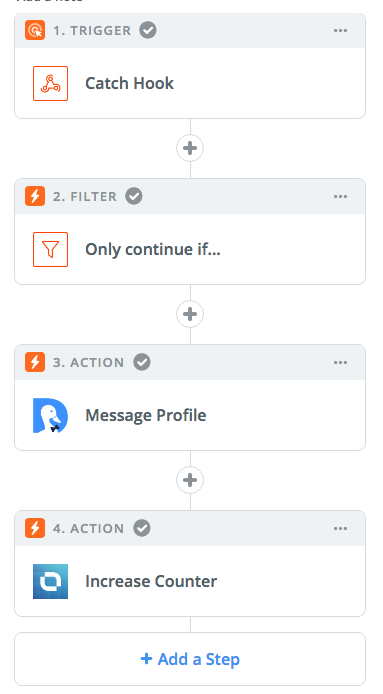
It’s important to note here that once you do set up the automated follow-up zap, you also need to add the Databox “increase counter” action as the last step, so that it actually counts the follow ups, like so:
Then, the settings for that in DataBox should be similar, just with a different custom metric.
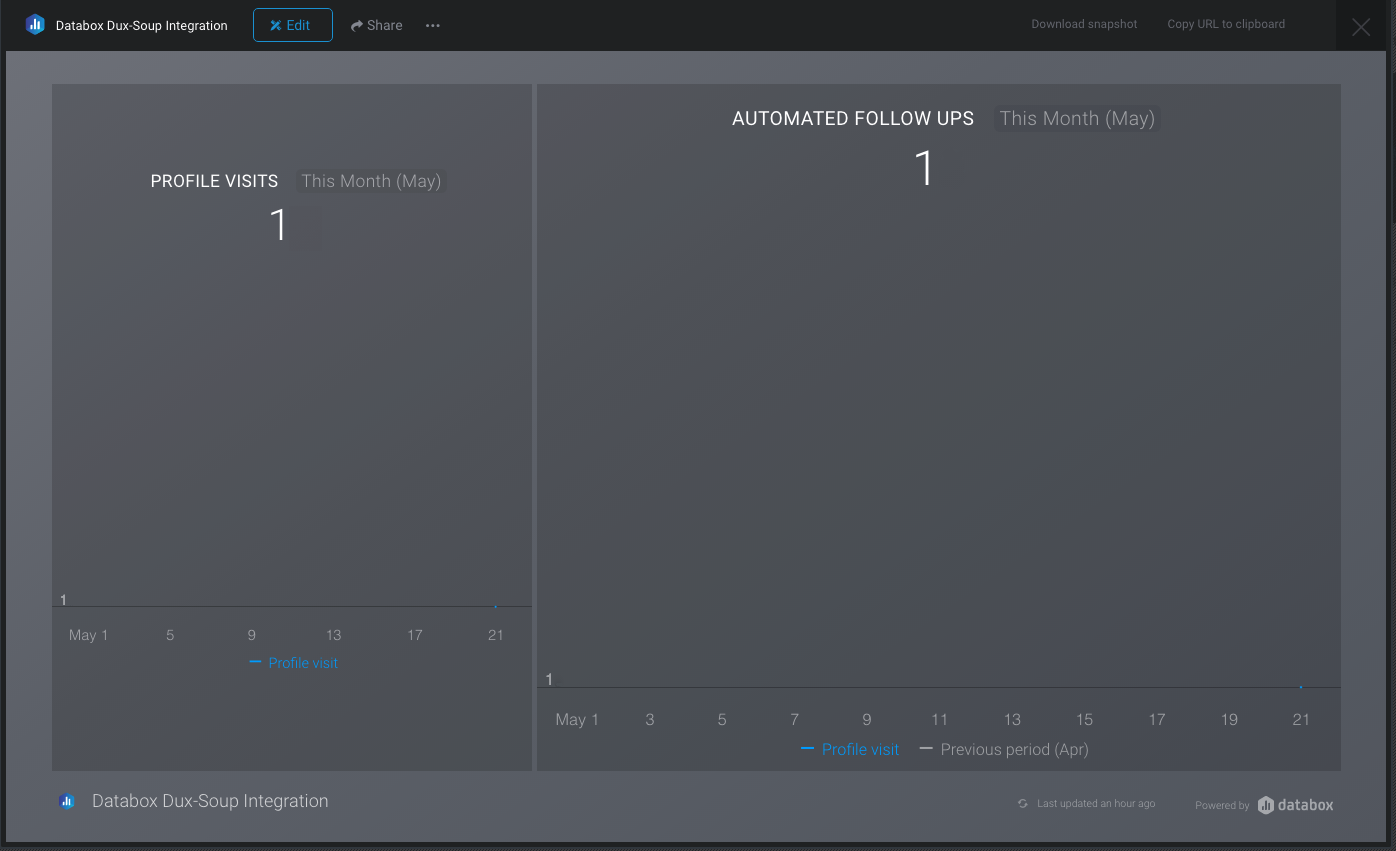
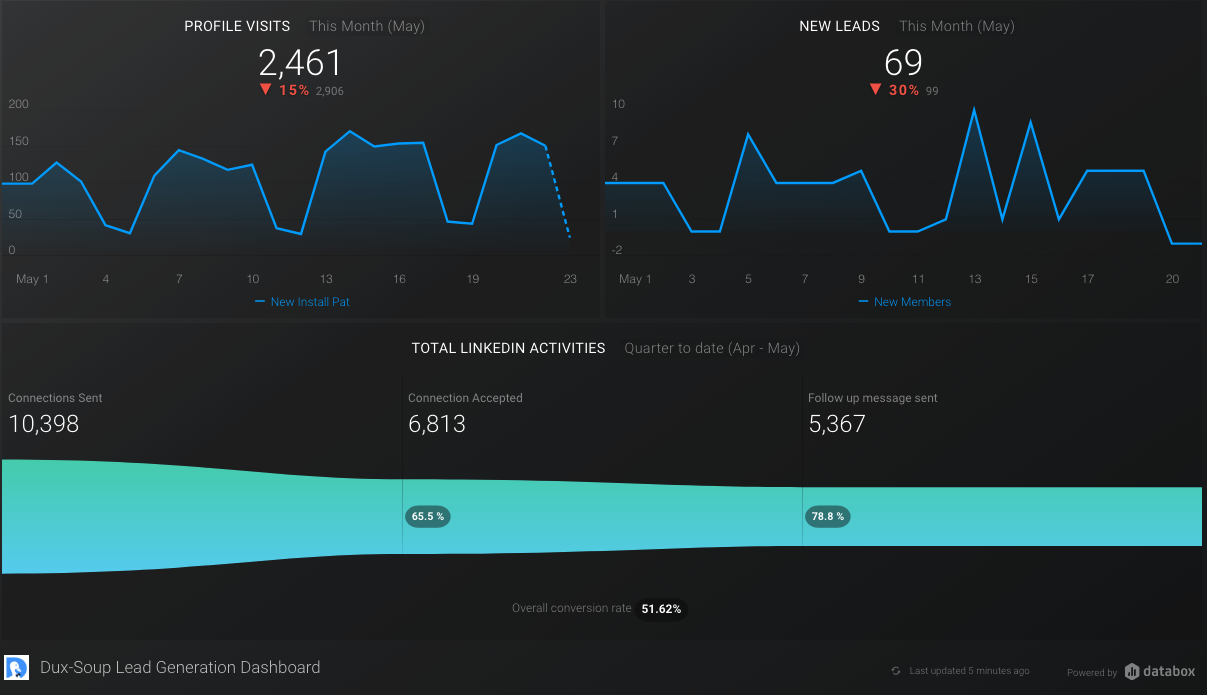
Finally, if everything has been working as intended, you should have a dashboard showing you how Dux-Soup Turbo has been performing so far.
What’s next?
With this integration, you can practically track as many things as you’d like - the sky’s the limit!
As an example, here’s the live dashboard we set up within our team that breaks down each of the lead generation metrics we’re keeping track of:
Should you have any questions or comments, feel free to contact us. You can reach us at info@dux-soup.com or join our user group where we’re always ready to help!


